
Fact Book
Welcome to the Fact Book
A comprehensive and interactive source of data and information about our university
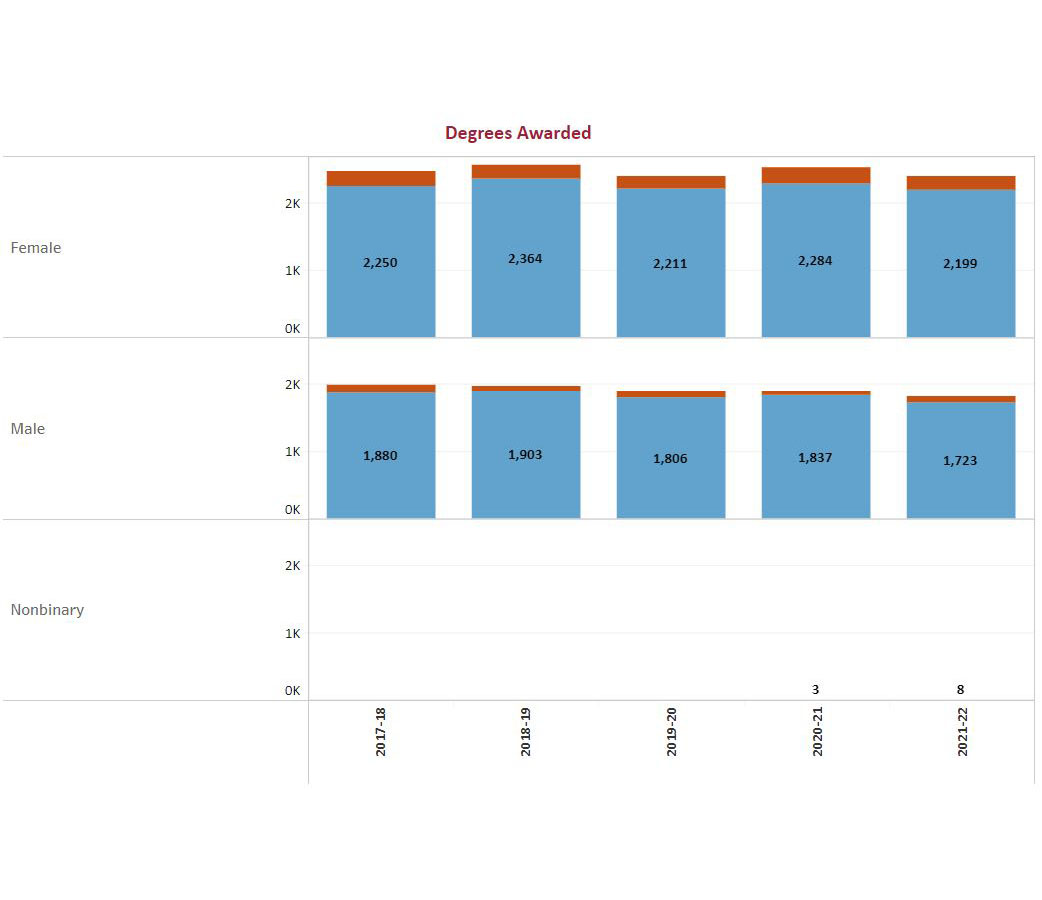
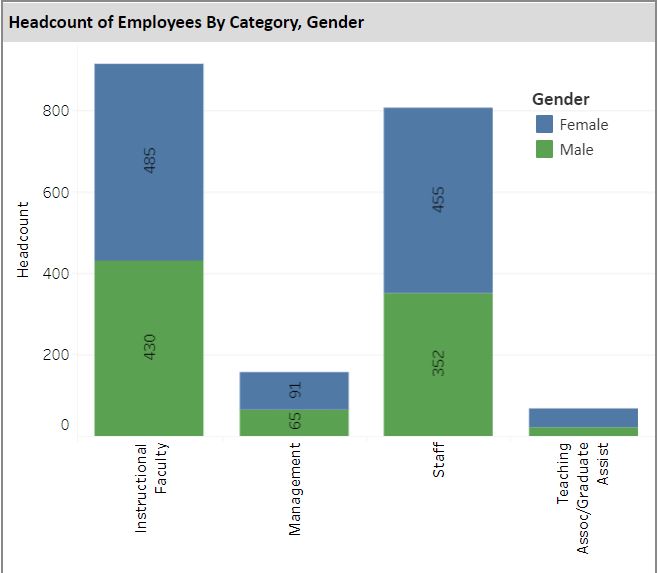
The Fact Book is a collection of dashboards that display various aspects of our students, faculty, and programs. You can explore data on topics such as applications, retention, persistence, graduation, degrees conferred, course grades, and diversity measures. The Fact Book is a valuable tool to gain insights into our diverse and dynamic community.
The data in the Fact Book are derived from official reporting to the CSU System Office and Department of Education. The dashboards are updated periodically to reflect the most current and accurate information available.
To access the Fact Book, select the topic of interest from the list below.
Special Topics
* User account required (active students and employee access only)