Data and Demographics
By the Numbers
36%
Latinx Students
44%
First-Generation Students
2.2%
International Students
Demographic Dashboards
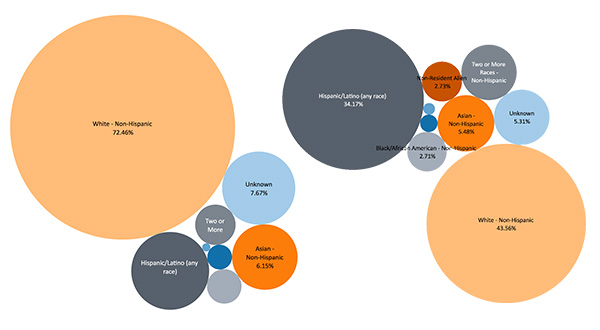
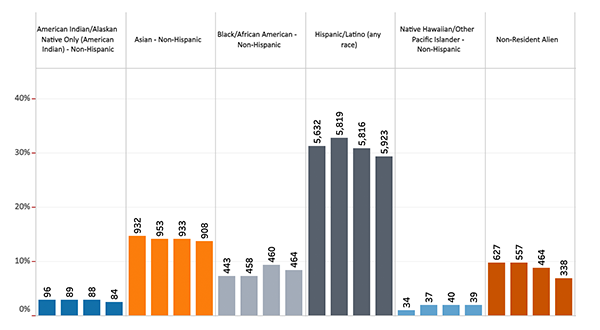
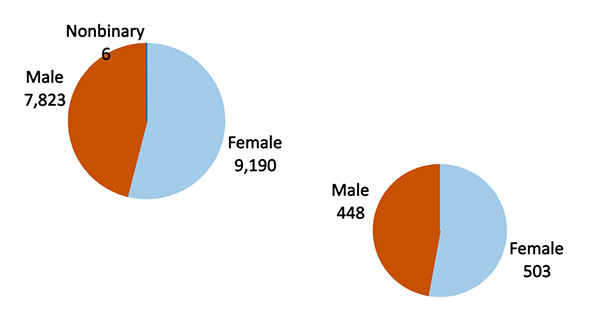
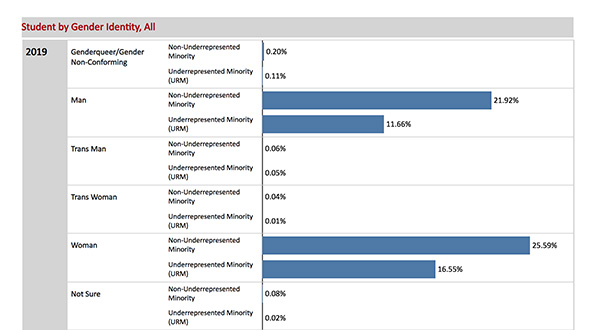
Chico State continues to set ambitious goals to increase workforce and student diversity as well as ensuring success across demographics. These dashboards provide an at-a-glance view of our student and employee populations.
Find additional dashboards and demographic data in the Institutional Research Fact Book.
City of Chico Community Demographics
| Race and Origin | Percentage |
|---|---|
| American Indian/Alaskan Native | 0.8% |
| Asian | 5.2% |
| Black/African American | 2.1% |
| Hispanic or Latinx | 19.2% |
| Pacific Islander | 0.5% |
| White | 67.9% |
| Two or more races | 10.1% |
Note: People who identify as Hispanic may be of any race, so also are included in applicable race categories, making the total greater than 100%.
Source: US Census Bureau


