
Activity Based Costing Model (22-23 Condensed Version)
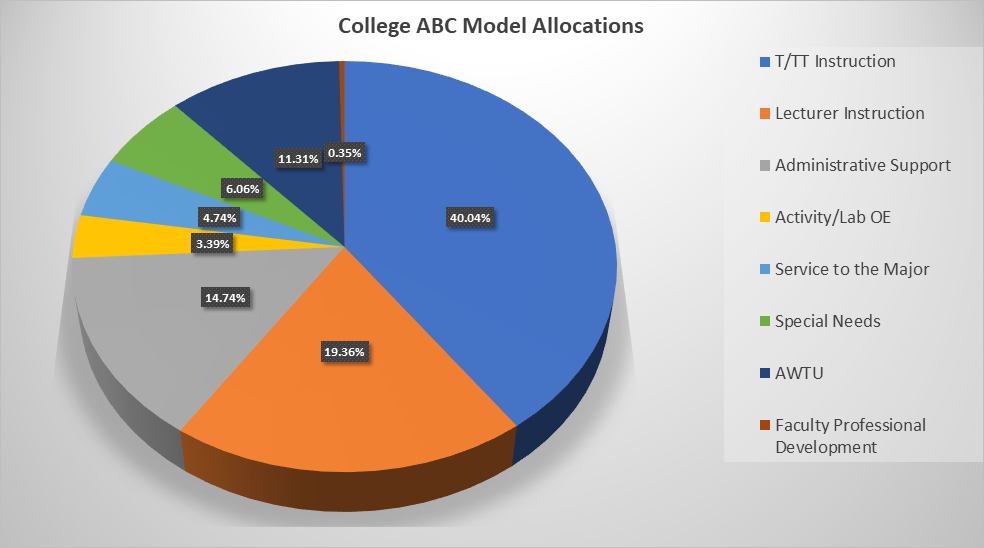
College | T/TT Instruction | Lecturer Instruction | Administrative Support | Activity/Lab OE | Service to the Major | Special Needs | AWTU | Faculty Professional Development | Total ABC Model Allocation |
AGR | 1,505,684 | 505,789 | 758,169 | 256,000 | 225,300 | 1,135,856 | 380,244 | 12,600 | 4,779,642 |
BSS | 6,539,273 | 3,358,058 | 2,265,390 | 246,000 | 821,610 | 227,586 | 1,824,818 | 60,000 | 15,342,736 |
BUS | 3,279,817 | 1,877,552 | 1,383,961 | 202,500 | 510,975 | 219,096 | 922,309 | 20,400 | 8,416,610 |
CME | 4,709,164 | 2,372,785 | 1,566,867 | 378,500 | 587,805 | 262,764 | 1,126,172 | 37,200 | 11,041,257 |
ECC | 3,941,764 | 1,136,845 | 1,163,344 | 429,000 | 517,800 | 268,398 | 938,003 | 28,200 | 8,423,355 |
HFA | 3,788,395 | 2,035,917 | 1,602,432 | 338,000 | 271,125 | 494,859 | 1,257,387 | 39,000 | 9,827,115 |
NSC | 4,634,726 | 2,442,823 | 1,712,791 | 556,000 | 428,490 | 1,692,619 | 1,575,410 | 51,600 | 13,094,460 |
Total Colleges | 28,398,823 | 13,729,770 | 10,452,954 | 2,406,000 | 3,363,105 | 4,301,178 | 8,024,343 | 249,000 | 70,925,173 |
ABC Details
Model Initialization
The Activity Based Costing Model uses the campus annualized FTES target to compute base allocations which has been distributed across the colleges based on percent of contribution to prior-year FTES actuals (includes trades), discussions with deans, and trend data. Projected FTES in the respective categories (T/TT, Lecturers; GE, LD, UD, and Grad) are based on prior-year ratios applied to the current FTES target.
Instructional Allocations
Funding per FTES in each of the categories was computed using average prior-year actual faculty costs. An additional allocation for Writing Intensive Courses recognizes the effects of an enrollment cap of 30 (rather than 50) in these courses. An enrollment of 50 would generate 10 FTES; enrollment of 30 produces 6 FTES.
Salary Index Multiplier
Funding per FTES in each of the categories is indexed based on actual faculty salary data by college.
Administrative Support Allocations
Dean's office allocation is based on the average costs for one dean, associate dean, AAS and ASC, and $50 per FTES; Department allocation: Allocates by FTES and incorporates the faculty salary index for the chair portion.
Academic Technology (ATEC) Allocations
Allocates $200K to each college + $500 per the count of each Activity/Lab Course Sections (07,08,09,10,11,12,13,15,16)
Allocation for Service to the Major
The major allocation recognizes the additional costs associated with serving the major, i.e. advising and departmental costs.
Special Needs Allocation
The Special Needs Allocation recognizes the high cost and/or special instructional requirements (not covered in other columns) of select disciplines/majors. Allocations are based on a dean review and analysis of technology or lab support staff, special operating expenditures, and administrative agreements. Additionally, professional development allocations (using T/TT headcounts) are contained in these amounts.
AWTU
AWTU allocations were determined based on the college percentage of total T/TT headcount multiplied by the collective amount allocated for this purpose ($8M), multiplied by the salary index.
FTES Targets
FTES Targets were determined based on prior year actual FTES in each college, and applying their percentage to the estimated 21-22 collective campus target.
T/TT Faculty Headcounts
Each college reported their T/TT headcounts (department chairs are included as faculty).
Major Headcounts
Major headcounts are calculated using annualized primary and secondary major counts from the prior fall semester.