
PSP Assessment Academic Year 2014-2015
Bringing Theory to Practice Assessment Report
DATA SOURCE: CSUC Public Sphere Pedagogy Assessment Surveys, Fall 2014 and Spring 2015.
| Program | AY-14-15 |
|---|---|
| U-Course | 59.5% (88) |
| Comparison group (No Program) | 46.7% (142) |
NOTE: There is a statistically significant difference between the U-Course and the Comparison Group [Chi-Square = 6.47, p = .01]. The comparison group is students surveyed in introductory American Government classes of similar size—at the same time as U-Course students—who were not participants in any civic engagement program.
| Program | AY-14-15 |
|---|---|
| U-Course | 53.9% (82) |
| Comparison group (No Program) | 32.9% (102) |
NOTE: There is a statistically significant difference in percentages in above table (Chi-Square = 33.48, p = .00). The comparison group is students surveyed in introductory American Government classes of similar size—at the same time as U-Course students—who were not participants in any civic engagement program.
| Program | AY-14-15 |
|---|---|
| U-Course | 53.9% (82) |
| Comparison group | 26.0% (80) |
NOTE: There is a statistically significant difference in percentages in above table (Chi-Square = 39.83 p = .00). The comparison group is students surveyed in introductory American Government classes of similar size—at the same time as U-Course students—who were not participants in any civic engagement program.
| Program | AY-14-15 |
|---|---|
| U-Course | 42.8% (658) |
| Comparison group (No Program) | 29.9% (922) |
NOTE: There is a statistically significant difference in percentages in above table (Chi-Square = 9.67, p = .01).
The comparison group is students surveyed in introductory American Government classes of similar size—at the same time as U-Course students—who were not participants in any civic engagement program.
Data Analysis Narrative Provided to the Chancellor's Office
Through extensive qualitative analysis of written student reflections, as well as quantitative analysis through the dissemination of a survey, we found that the U-Course effectively meets goals under student well-being and civic efficacy. Most students at the end of the U-Course were either “flourishing” (42.1%) or “moderately mentally healthy” (52.4%). Although there was no significant difference in well-being between students in the U-Course and the comparison group of students who were in no programs, the project evaluation team who worked on analyzing these data indicated that changes in flourishing frequently take time to register and are more likely to be seen at a greater remove from students' enrollment in and completion of a U-Course. Additionally, one of the most salient themes to emerge from the qualitative analysis, identity, appeared in 52.5% of student reflections. Identity statements reflected positive growth from the students in their academic, social, and public lives; hence, we see this theme as related to flourishing. For example, one identity statement reads: “I can honestly say that I came out of this class a new person . . . of all my classes I grew as a person the most from this one right here.” Furthermore, Boyd and Nowell (2014) also consider “psychological sense of community” as a well-being measure, and our research found significant differences on this measure between U-Course students and non-U-Course students.
We found that in comparison to non-U-Course students, significantly more U-Course students are more willing to help others, care more strongly about helping others, and feel a sense of responsibility to give to their class community without needing anything in return. Moreover, significantly more (59.5%) students from the U-Course feel that they can make a big or moderate impact in their communities compared to just under half (46.7%) of students who were not in any program. Additionally, agency, the most salient theme to emerge from our qualitative analysis, appeared in 66.9% of student reflections. U-Course students demonstrated a strong belief in their civic efficacy overall, believing that they can make a positive difference in their community. This was exemplified with the following student quotation: “I have come so far and invested so much in this policy issue that there is no way I wouldn't try to make a difference, even if it is a small one." Our analysis also found that U-Course students demonstrated a sense of awareness, which was the second-most salient theme to emerge from the data, appearing in 54% of the reflections. Awareness was defined as the students’ abilities to recognize learning, leading to students’ abilities to reflect and better understand their learning. Awareness statements were almost always tied with identity and agency statements, providing the argument that U-Course faculty and mentors have the capacity to address and foster student well-being. For example, one student wrote, “This class is one that has truly impacted my life, and made me realize things that I never thought about before. I am more aware of the things I would like to be involved in to make a difference in the world." Overall, the relationship between the themes of awareness, identity, and agency tell us that U-Course faculty and staff are able to foster a sense of awareness in students, leading to students developing flourishing identities and a stronger sense of community and responsibility to that community.
Town Hall Persistence
In 2015, Dr. Robin Donatello conducted an assessment that examined “Characteristics of Dropout” focused on CSU, Chico students “who drop out after their second year to those that don’t.” The study examined the records of students from 2009-2013 who had no missing data. This graphic is from that study.
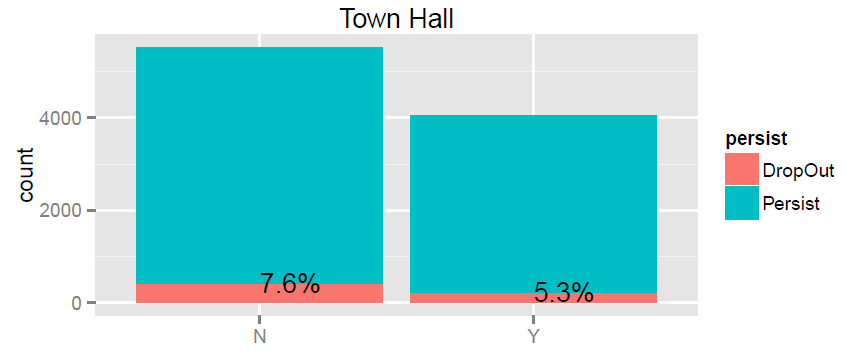
There is a statistically significant difference in the proportion of dropout depending if the student attended a Town Hall meeting (p <.001).
References
- Boyd, N., & Nowell, B. (2014). Psychological Sense of Community. Journal of Management Inquiry, 23(2), 107-122.